EnGen® Spy Cas9 HF1

Catalog # Concentration Size List Price Quantity Your Price
M0667M 20 µM 2500 pmol $1,099.00
$989.10
M0667T 20 µM 500 pmol $276.00
$248.40
Catalog # Size List Price Your Price
M0667M 2500 pmol $1,099.00
$989.10
M0667T 500 pmol $276.00
$248.40
Catalog #
Qty:
 
*On-line ordering is for Canadian customers only. Web pricing is applicable only to orders placed online at www.neb.ca
  • High-fidelity variant of Spy Cas9 nuclease differing by four point mutations (N497A/R661A/Q695A/Q926A) reduces off-target cleavage
  • Ideal for direct introduction of Cas9/sgRNA complexes
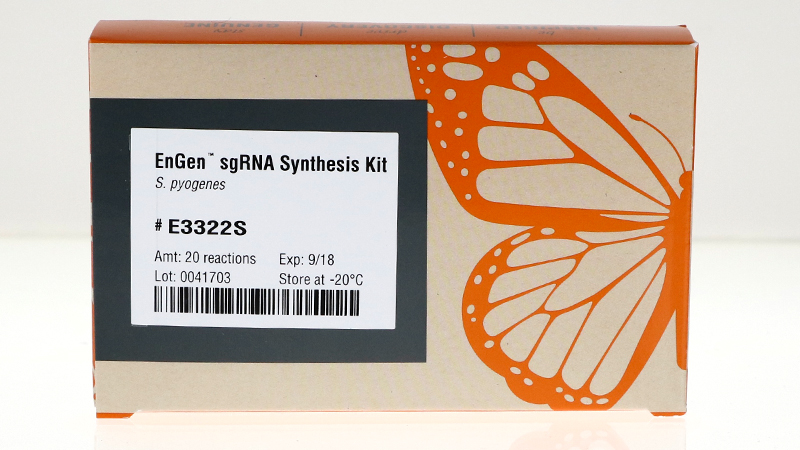
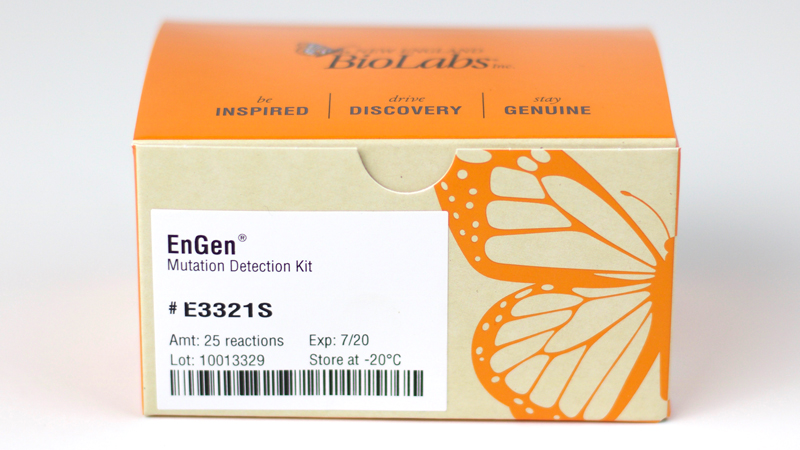
  • Compatible with EnGen sgRNA Synthesis Kit, S. pyogenes (NEB #E3322S) and the EnGen Mutation Detection Kit (NEB #E3321S)
 
Featured Videos
View Video Library
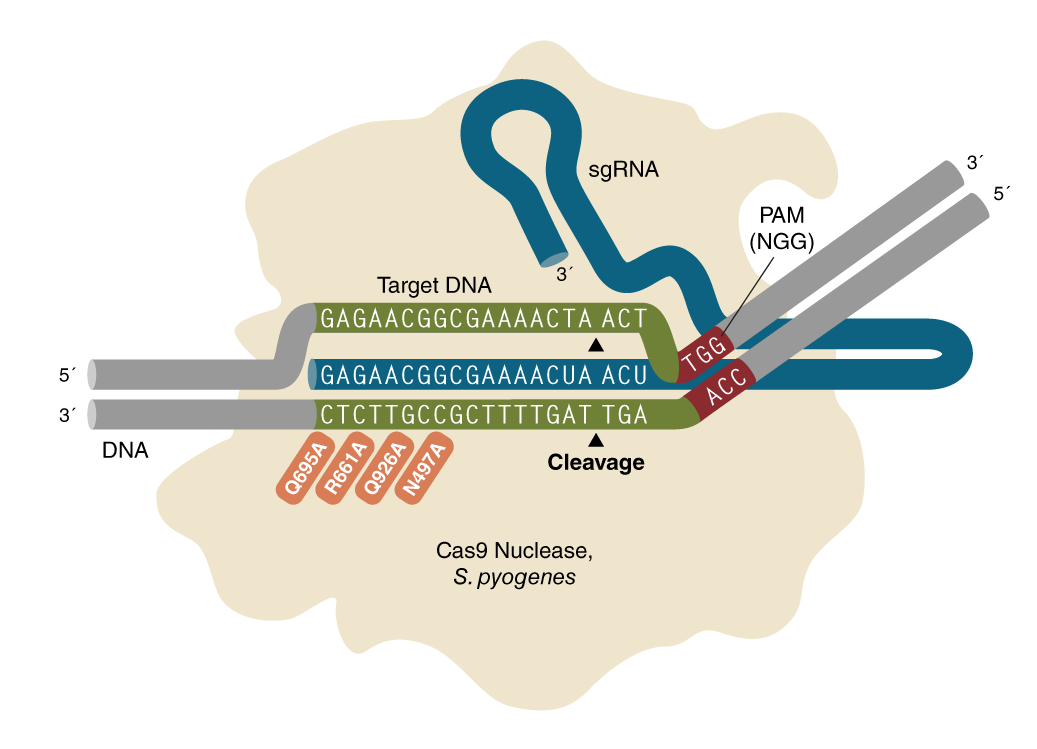
EnGen Spy Cas9 HF1 is a high-fidelity, quadruple substitution (N497A/R661A/Q695A/Q926A) variant of EnGen Spy Cas9 NLS from Streptococcus pyogenes with reduced non-specific DNA cleavage. Spy Cas9 is an RNA-guided endonuclease that catalyzes site-specific cleavage of double stranded DNA. The single guide RNA (sgRNA) targets Cas9 to the region immediately upstream of a 5′-NGG-3′ protospacer adjacent motif (PAM) producing a double stranded break 3 bases upstream of the PAM (1). EnGen Spy Cas9 HF1 contains Simian virus 40 (SV40) T antigen nuclear localization sequence (NLS) on the N- and C-termini of the protein.

Figure 1. Schematic representation of S. pyogenes Cas9 nuclease complexed with a single guide RNA and target DNA

M0667

S. pyogenes Cas9 (Spy Cas9) protein is shown in beige, single guide RNA (sgRNA) is depicted in blue, and the DNA is shown in grey, green, and red. The DNA target, or protospacer, is shown in green and the base pairing complementarity of the target strand with the guide RNA in the R-loop is illustrated. The protospacer adjacent motif (PAM) which is required for Cas9 binding to DNA is shown in red and the locations of DNA strand cleavage are indicated with black triangles. Orange labels highlight the relative positions of mutated amino acid residues in Spy Cas9 HF1 (2) which contact the DNA backbone of the target strand in the PAM distal region of the RNP-DNA complex.


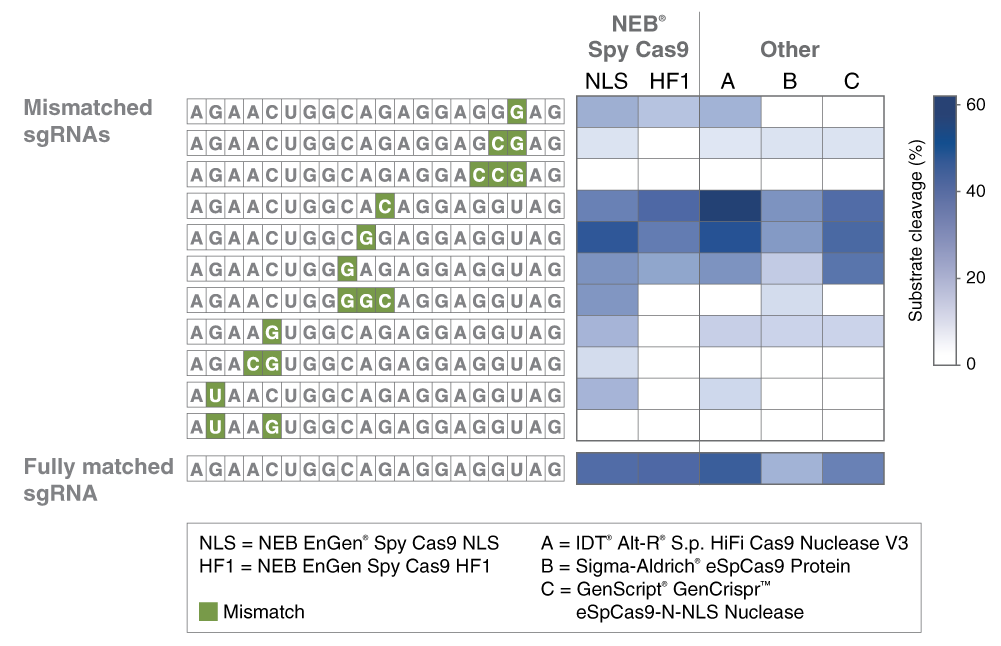
Figure 2. EnGen Spy Cas9 HF1 demonstrates increased sensitivity to mismatches between guide RNA and DNA targets in vitro

M0667

Comparison of the tolerance of mismatches between the guide RNA sequence and target DNA sequence of EnGen Spy Cas9 NLS, EnGen Spy Cas9 HF1, and other commercially available high fidelity Cas9 variants. One of several guide RNAs encoding a single, double, or triple mismatch with a fluorescently labeled dsDNA substrate were allowed to form a ribonucleoprotein (RNP) complex with each of five Cas9 variants. A fully matched guide RNA was included as a control. The RNPs were incubated with the substrate at a 2:1 ratio at 37°C for 5 minutes. The percent substrate cleavage for each RNP complex was measured by capillary electrophoresis. Results were graphed as a heat map with white representing no cleavage and increasing intensity of blue indicating increasing percent cleavage. The guide RNA sequence is indicated in each row, with mismatches denoted in green. The DNA protospacer sequence is 5´ – AGAACTGGCAGAGGAGGTAG – 3´ and the protospacer adjacent motif (PAM) is 5´– TGG – 3´. EnGen Spy Cas9 HF1 demonstrates increased sensitivity to mismatches by showing the greatest ratio of on-target cleavage to average cleavage of off-targets.


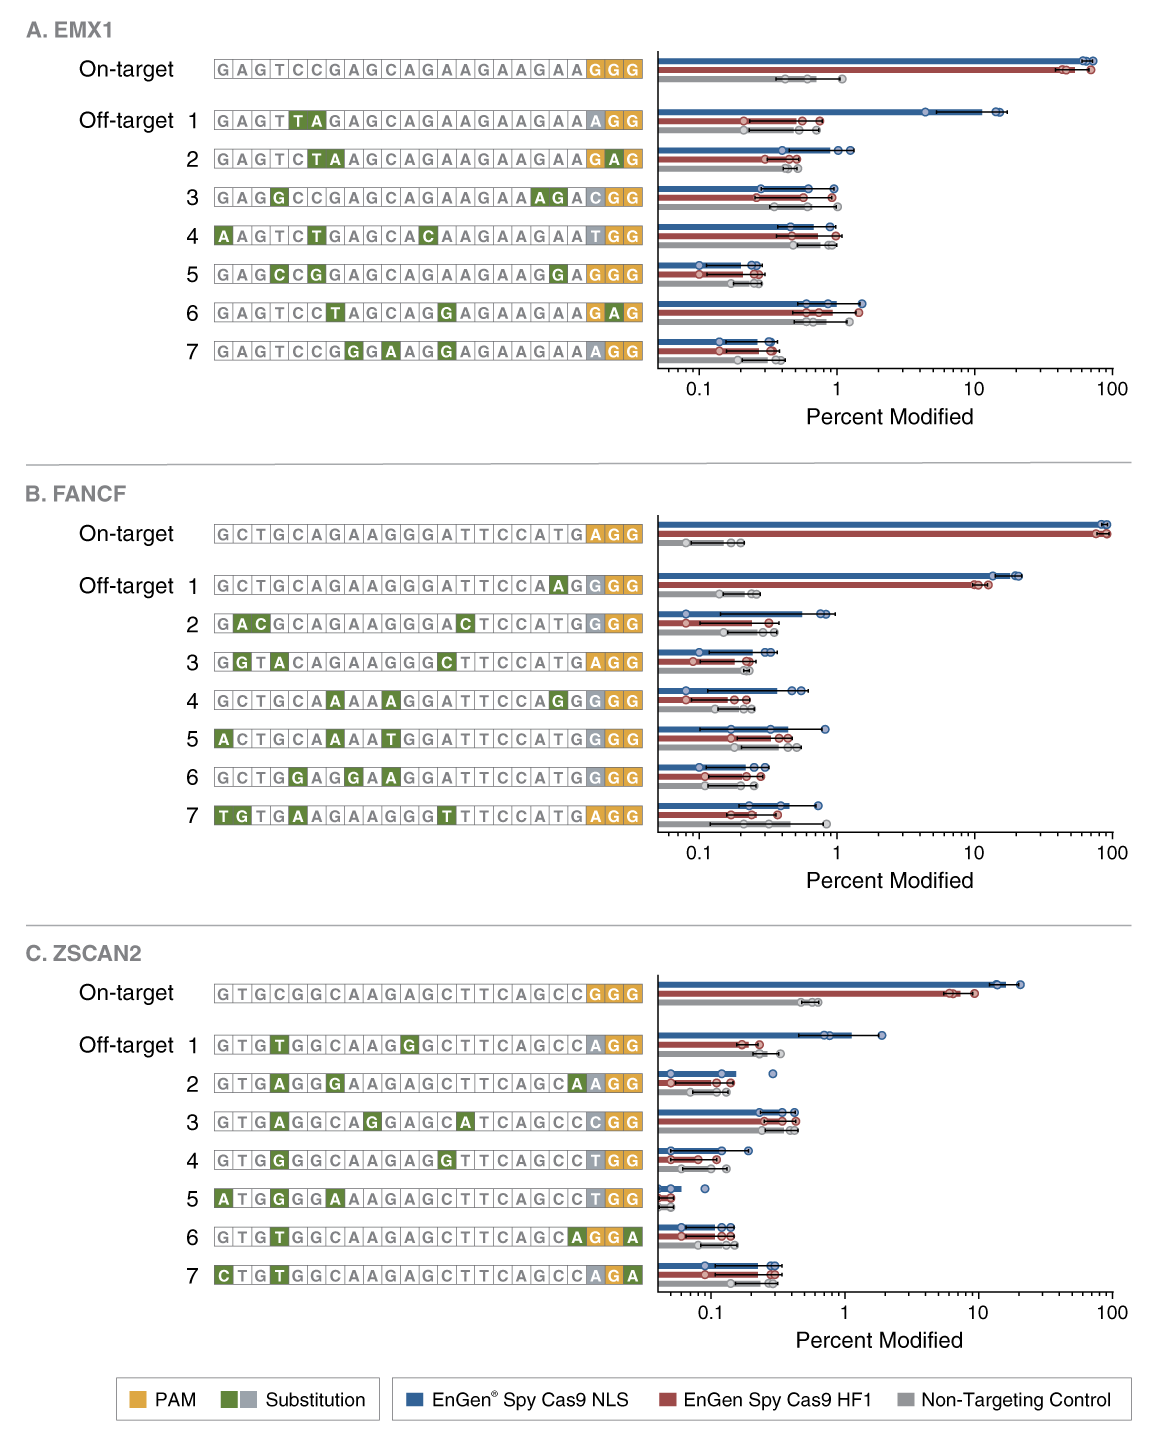
Figure 3. On-target and off-target genome editing efficiency of EnGen Spy Cas9 NLS and EnGen Spy Cas9 HF1 at three different loci

M0667

Determination of EnGen Spy Cas9 HF1 fidelity by next-generation sequencing. 1x10⁵ HEK293 cells were electroporated with EnGen Spy Cas9 NLS (wild-type) and EnGen Spy Cas9 HF1 RNPs targeting EMX1 (A), FANCF (B), and ZSCAN2 (C) genomic loci (2); RNPs were pre-formed in Nucleofector Solution at a concentration of 2 μM Cas9 and 4 μM sgRNA. 48–72 hours post electroporation, genomic DNA was extracted from electroporated cells and PCR was performed to amplify DNA from the on-target genomic loci and 7 corresponding off-target loci previously identified using GUIDESeq (2). The amplification products were converted to Illumina® sequencing libraries using NEBNext® Ultra™ II DNA Library Prep Kit for Illumina and NEBNext Multiplex Oligos for Illumina. Sequencing data was analyzed using CRISPResso version 2 (3). Percent modification of on-target and seven off-target sites (ranging from 1–4 substitutions) are plotted for EnGen Spy Cas9 NLS (wild-type), EnGen Spy Cas9 HF1, and a non-targeting control. For each genomic site, the target sequence is shown with PAM in gold boxes; substitutions in off-target sites relative to the on-target site are represented in green boxes, unless it occurs in the variable position of the PAM, which is represented in grey boxes. Experiments were performed in triplicate. Error bars represent standard deviation. 


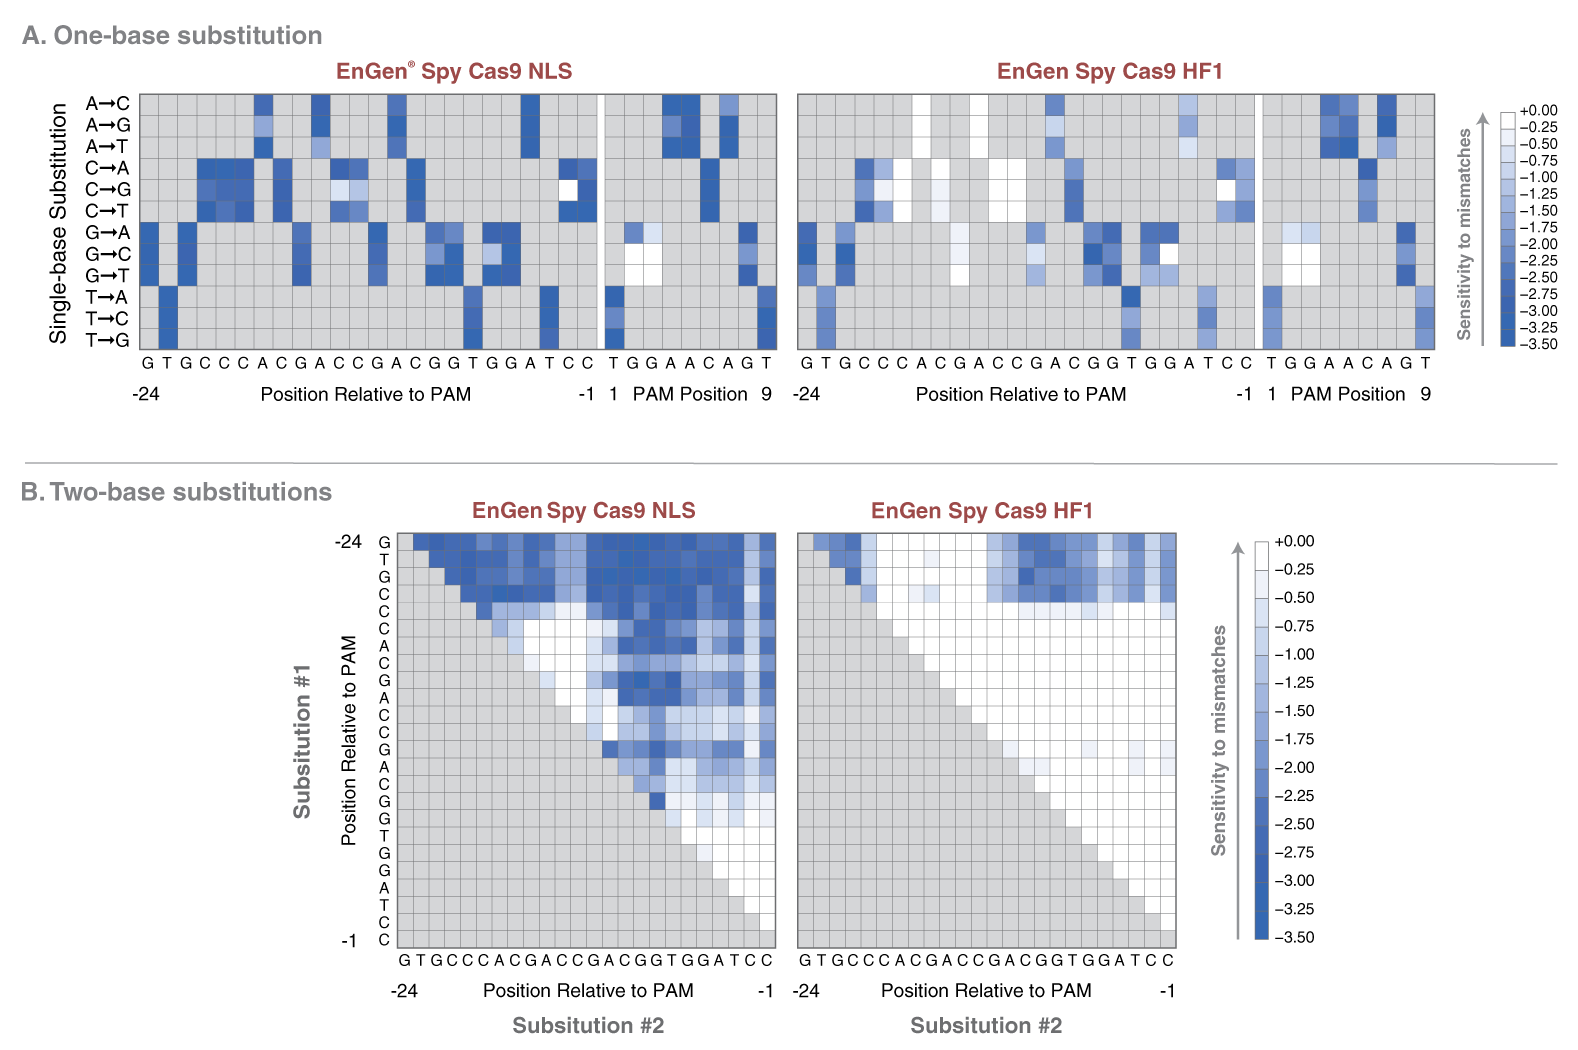
Figure 4. EnGen Spy Cas9 HF1 demonstrates increased sensitivity to substitutions in DNA targets in vitro

M0667

Comparison of the tolerance of one- or two-base substitution mismatches between the guide RNA sequence and target DNA sequence of EnGen Spy Cas9 NLS and EnGen Spy Cas9 HF1 demonstrates higher target specificity of EnGen Spy Cas9 HF1. A pool of DNA substrates containing every possible 1 and 2 base substitution, insertion and deletion relative to a fully matched target sequence or every possible 1 base substitution relative to a canonical PAM sequence were subjected to cleavage with either EnGen Spy Cas9 NLS or EnGen Spy Cas9 HF1 at 37°C for 1 hour. DNA pools were amplified with 5 cycles of PCR to add sequencing adaptors and then sequenced by Illumina® sequencing. The ratio of abundance for each sequence was divided by the abundance in a DNA pool that was not cleaved with Cas9 and plotted on a log2 scale. A value of greater than or equal to 0.0 indicates that a sequence in the pool was not cleaved by Cas9, while a value less than 0.0 indicates cleavage by Cas9. The log2 value for members of the pool was plotted as a heat map with the axis corresponding to the location and/or type of substitution and the intensity of blue color corresponding to the log2 value.


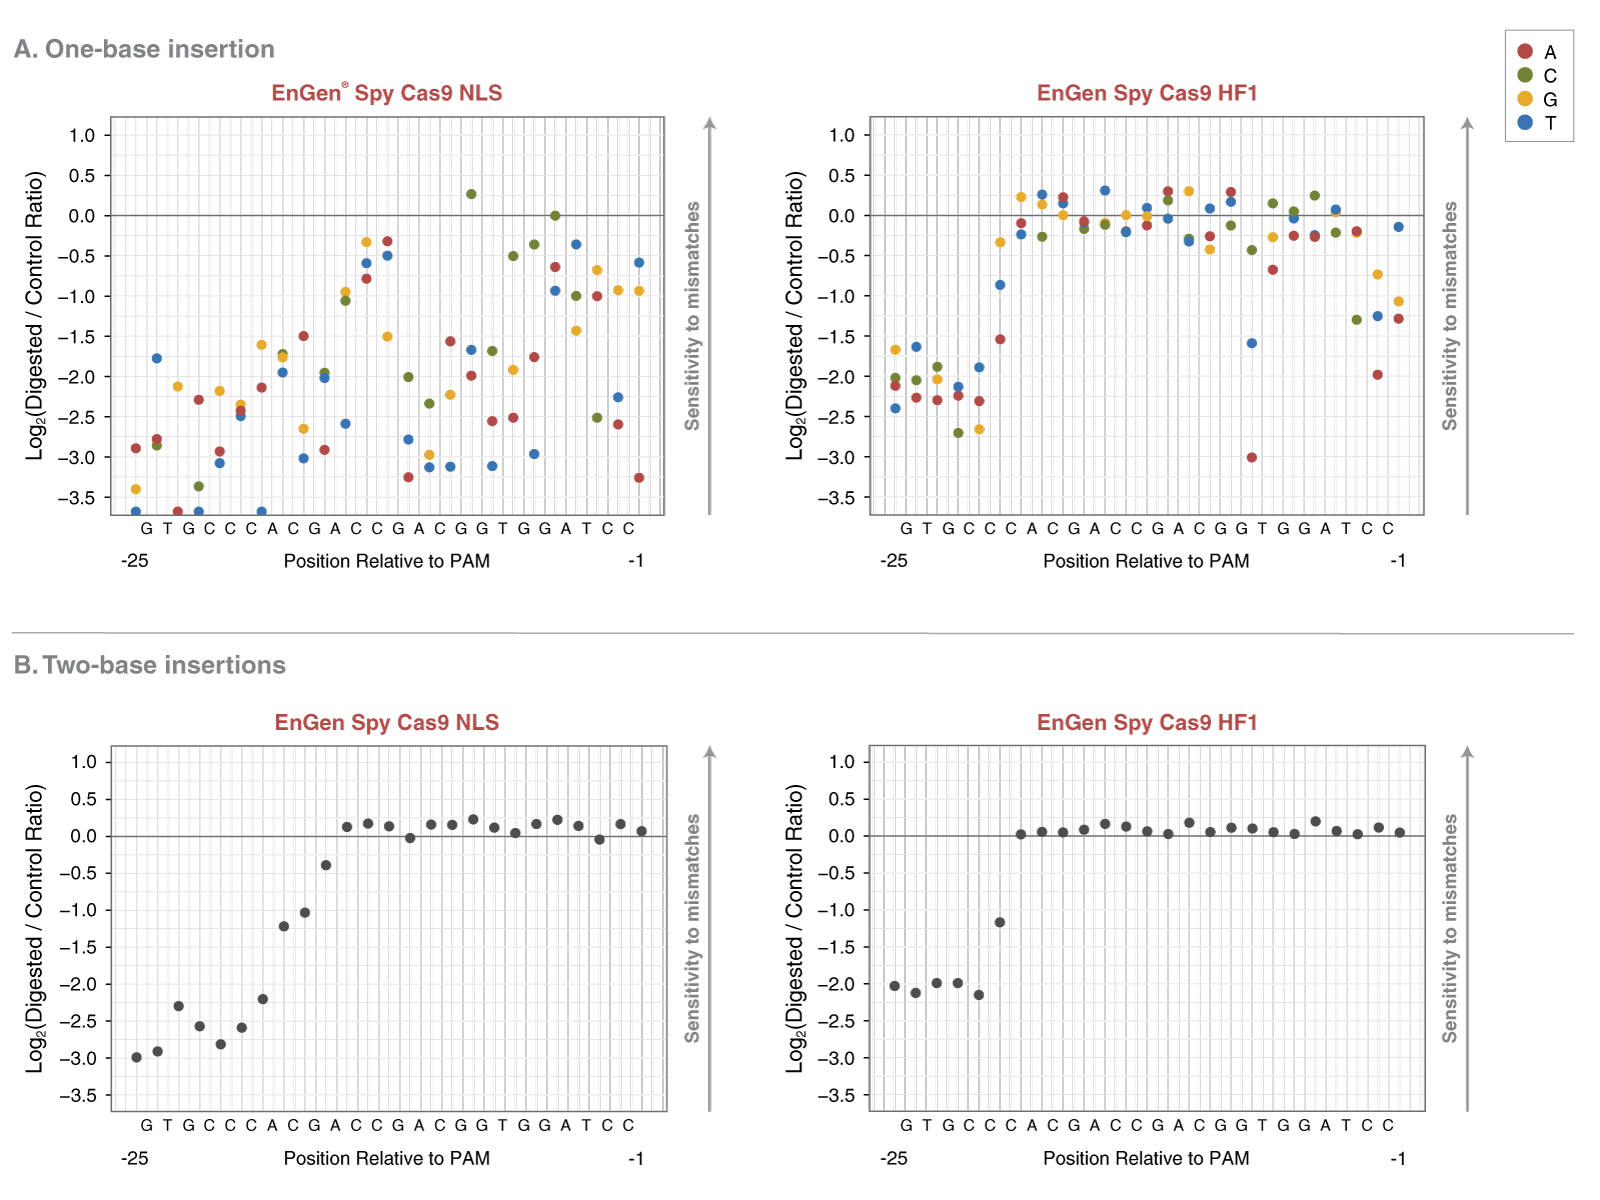
Figure 5. EnGen Spy Cas9 HF1 demonstrates increased sensitivity to insertions in DNA targets in vitro

M0667

Comparison of the tolerance of one- or two-base insertion mismatches between the guide RNA sequence and target DNA sequence of EnGen Spy Cas9 NLS and EnGen Spy Cas9 HF1 demonstrates higher target specificity of EnGen Spy Cas9 HF1. A pool of DNA substrates containing every possible 1 and 2 base substitution, insertion and deletion relative to a fully matched target sequence or every possible 1 base substitution relative to a canonical PAM sequence were subjected to cleavage with either EnGen Spy Cas9 NLS or EnGen Spy Cas9 HF1 at 37°C for 1 hour. DNA pools were amplified with 5 cycles of PCR to add sequencing adaptors and then sequenced by Illumina sequencing. The ratio of abundance for each sequence was divided by the abundance in a DNA pool that was not cleaved with Cas9 and plotted on a log2 scale. A value of greater than or equal to 0.0 indicates that a sequence in the pool was not cleaved by Cas9, while a value less than 0.0 indicates cleavage by Cas9. Results were graphed with the location of the insertion on the x-axis and the log2 value on the y-axis. Additionally for the 1-base samples, the type of base that was inserted at every position is indicated by colored dots.


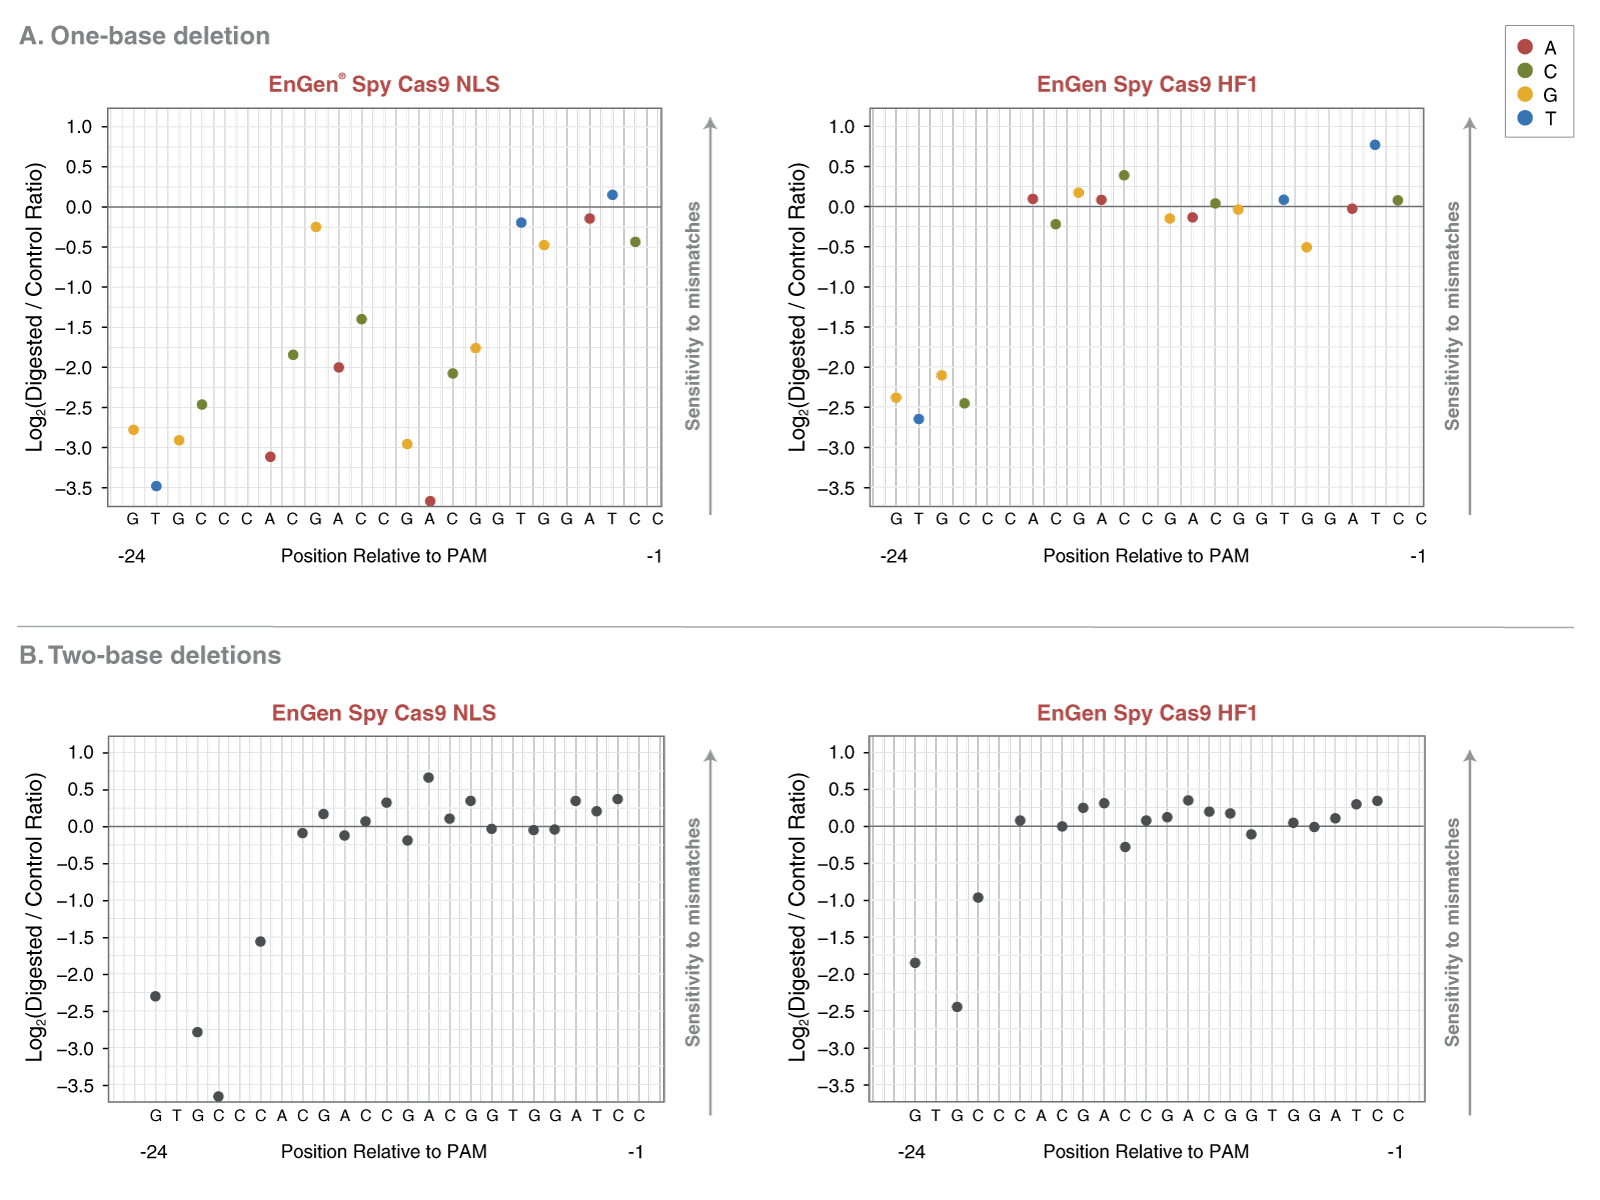
Figure 6. EnGen Spy Cas9 HF1 demonstrates increased sensitivity to deletions in DNA targets in vitro

M0667

Comparison of the tolerance of one- or two-base deletion mismatches between the guide RNA sequence and target DNA sequence of EnGen Spy Cas9 NLS and EnGen Spy Cas9 HF1 demonstrates higher target specificity of EnGen Spy Cas9 HF1. A pool of DNA substrates containing every possible 1 and 2 base substitution, insertion and deletion relative to a fully matched target sequence or every possible 1 base substitution relative to a canonical PAM sequence were subjected to cleavage with either EnGen Spy Cas9 NLS or EnGen Spy Cas9 HF1 at 37°C for 1 hour. DNA pools were amplified with 5 cycles of PCR to add sequencing adaptors and then sequenced by Illumina sequencing. The ratio of abundance for each sequence was divided by the abundance in a DNA pool that was not cleaved withCas9 and plotted on a log2 scale. A value of greater than or equal to 0.0 indicates that a sequence in the pool was not cleaved by Cas9, while a value less than 0.0 indicates cleavage by Cas9. Results were graphed with the location of the deletion on the x-axis and the log2 value on the y-axis. Additionally for the 1-base samples, the type of base that was deleted at every position is indicated by colored dots.


Product Source
An E. coli strain that carries the cloned Cas9 gene from Streptococcus pyogenes with N- and C-terminal Simian virus 40 (SV40) T antigen nuclear localization signal (NLS) and a N-terminal 6XHis tag.
Reagents Supplied

The following reagents are supplied with this product:

NEB # Component Name Component # Stored at (°C) Amount Concentration
  EnGen® Spy Cas9 HF1 M0667MVIAL -20 1 x 2,500 pmol 20 µM
  NEBuffer™ r3.1 B6003SVIAL -20 1 x 1.25 ml 10 X
  EnGen® Spy Cas9 HF1 M0667TVIAL -20 1 x 500 pmol 20 µM
  NEBuffer™ r3.1 B6003SVIAL -20 1 x 1.25 ml 10 X
An exception occurred during the operation, making the result invalid. Check InnerException for exception details.

Notes
  • 20 µM is equal to 3.22 mg/ml
References
Quality Control Assay
Quality Control tests are performed on each new lot of NEB product to meet the specifications designated for it. Specifications and individual lot data from the tests that are performed for this particular product can be found and downloaded on the Product Specification Sheet, Certificate of Analysis, data card or product manual. Further information regarding NEB product quality can be found here.
Specifications
The Specification sheet is a document that includes the storage temperature, shelf life and the specifications designated for the product. The following file naming structure is used to name these document files: [Product Number]_[Size]_[Version]
Certificate of Analysis
The Certificate of Analysis (COA) is a signed document that includes the storage temperature, expiration date and quality controls for an individual lot. The following file naming structure is used to name these document files: [Product Number]_[Size]_[Version]_[Lot Number]
Legal And Disclaimer

Products and content are covered by one or more patents, trademarks and/or copyrights owned or controlled by New England Biolabs, Inc (NEB). The use of trademark symbols does not necessarily indicate that the name is trademarked in the country where it is being read; it indicates where the content was originally developed. The use of this product may require the buyer to obtain additional third-party intellectual property rights for certain applications. For more information, please email busdev@neb.com.

This product is intended for research purposes only. This product is not intended to be used for therapeutic or diagnostic purposes in humans or animals.

New England Biolabs (NEB) is committed to practicing ethical science – we believe it is our job as researchers to ask the important questions that when answered will help preserve our quality of life and the world that we live in. However, this research should always be done in safe and ethical manner. Learn more.

Top